
Third Quarter 2026 Review
Climbing a wall of worry
Financial markets are often confusing and frequently feature cross currents that are difficult to navigate. Right now seems to be a particularly contradictory time in markets.
Look no further than the US stock market performance in the third quarter. From a 10,000-foot view, it looked like a typical quarter, with the S&P 500 Index generating a positive return of 2.3%. But the headline number masks some unusual trends. The stocks that did best in the first half of 2026 were likely to be the biggest losers in the third quarter, and vice versa. For example:
For stocks in the Russell 1000 Index that were DOWN more than 20 percent in the first half of the year, the average GAIN was 8.8 percent in Q3. A total reversal of fortunes for this group.
And for stocks that were UP more than 20 percent in the first half, the average LOSS was 6.9 percent in Q3. The winners became losers and the losers became winners.
September saw another unusual trend under the hood. The market itself remained buoyant, and yet the average stock started to break down. This is sometimes referred to as poor market breadth – although the market overall remained near all-time highs, individual names and sectors looked weak.
And then there were the bevy of headlines. Interest rates surged in the last few weeks of September, but the economy remains robust with unemployment below long-term averages and strong GDP growth. We have the ongoing war in Iran, with its on-again, off-again narrative whipsawing oil prices daily. We have sticky, persistent inflation and the Federal Reserve raising short-term interest rates again. This all happens amidst an AI buildout with spending unlike anything the world has ever experienced, while facing a growing backlash against data centers and the speed of AI progress itself. Not to mention, the midterms are coming.
These cross currents make investing in any single theme as difficult as ever. Amidst these confounding narratives, we recall the words of legendary investor Bill Miller:
“When I am asked what I worry about in the market, the answer usually is “nothing”, because everyone else in the market seems to spend an inordinate amount of time worrying, and so all of the relevant worries seem to be covered. My worries won’t have any impact except to detract from something much more useful, which is trying to make good long-term investment decisions.”
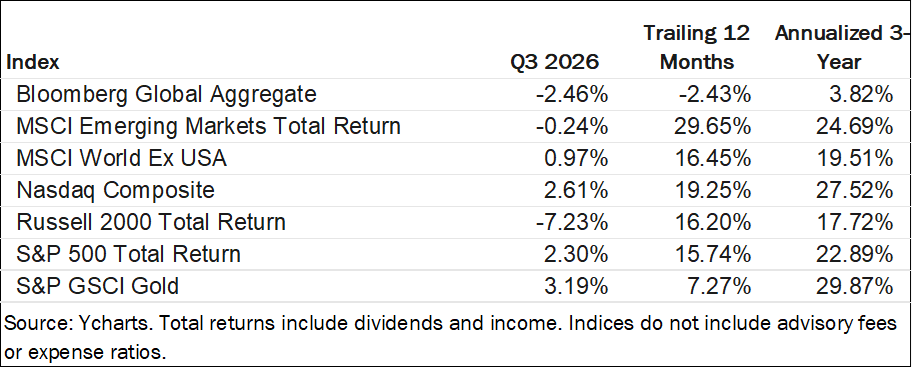
Benchmarking performance
Clients and prospective clients often ask about our historical track record. We are required to answer this in a vague manner, without citing specific performance. One of the primary reasons is for regulatory compliance. But more importantly, we can’t give a precise measure of portfolio performance because every client portfolio is different.
First of all, portfolios differ strategically by client based on goals and risk tolerance. But even two “moderate” portfolios can differ because of cash flows into or out of the portfolio, the timing of investments and rebalances, whether the portfolio is taxable or tax deferred, and whether clients have specific investment mandates.
Despite these idiosyncrasies, we think it is valuable to review our model portfolios and benchmark them against a passive benchmark. We can learn from our past decisions and try to always improve our investment framework. To this end, we try to compare the performance of our model moderate portfolio against a passive (60/40) benchmark. This passive benchmark is composed of 60 percent global stocks (MSCI ACWI Index) and 40 percent global bonds (Barclays Global Aggregate Bond Index). The one-year performance of this benchmark through the end of September without any fees was 8.85 percent.
Is this a good benchmark for you? Not necessarily. If your portfolio is more aggressive, with a higher allocation to stocks, you would expect more growth in the past year. If your portfolio is more conservative, with more cash on the sidelines for example, you would expect less growth. But it’s a decent starting point for moderate investors.
We’re happy to say when we look at our model portfolio and client performance, we have seen a healthy amount of outperformance versus this benchmark in the last year, even after fees. While not every decision has been additive, our active decisions have led to outperformance in aggregate. Take a look at your quarterly statement – provided to you via our eMoney financial planning portal – and please let us know if you have any questions about portfolio performance.
New Advisor, October 21st Panel Discussion, November 6th Webinar
We are excited to formally announce that Bryce Schuler, CFP® has joined Tableaux Wealth as a Financial Advisor. Bryce is a proud native of Stockbridge, MA. He currently lives in Southern NH, where he launched a Tableaux Wealth office in the heart of Peterborough, NH. As a CFP® professional, Bryce brings a passion for comprehensive financial planning on which Tableaux prides itself.
We are hosting a panel discussion on Wednesday, October 21st from 5 to 6:30PM at the Berkshire Waldorf School in Stockbridge, MA. Matt, Luke, Bryce, and Joe will discuss some financial horror stories they’ve experienced, so we can all learn what not to do. Please join us for light snacks and drinks, and feel free to bring your friends.
Finally, we invite everyone to join us for our next quarterly Tableaux Market Picture Webinar on Friday, November 6. All online registrants will receive a link to a recorded version of the webinar after the event.