
Second-Quarter 2026 Review
What’s Driving Markets?
Our investment committee meets monthly to go through pertinent economic and market data. We look at key economic factors such as employment, inflation, money supply, dollar strength, GDP, and interest rates. The data we evaluate can give us a sense of the current economy and informs our future market expectations.
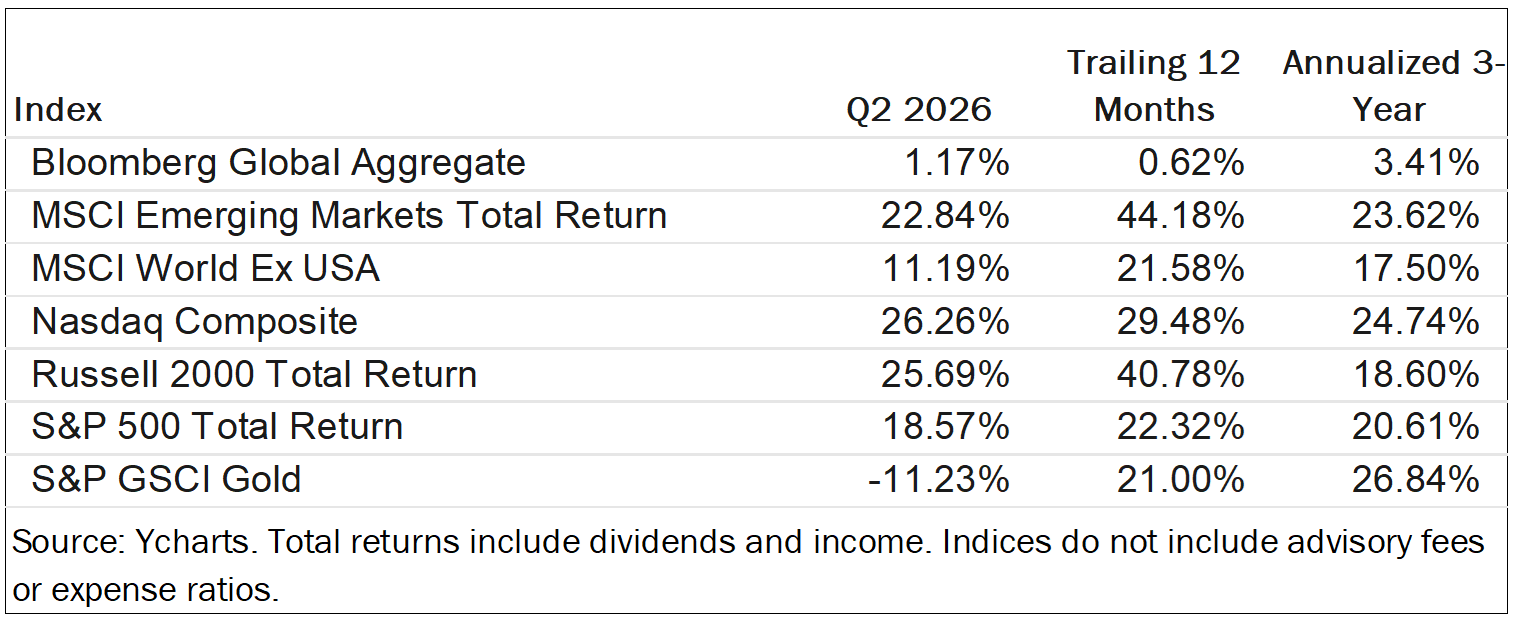
Economic growth is a critical component of stock market growth. But we’ve seen a disconnect this year. Economic growth is good, but not spectacular. Nevertheless, the broad stock market continues to set new all-time highs after three straight years of double-digit gains. The resounding strength of the stock market seems stronger than the underlying economy.
The biggest reason for this, in our opinion, is earnings growth, which has been driven by artificial intelligence. We’re in the midst of a massive “capex cycle.” Capex is short for capital expenditures, and it basically means that companies are spending their free cash flow at a record pace to build the AI infrastructure. More than half of the S&P 500 is now considered AI-related. The companies caught up in the bonanza include semiconductor stocks, hyperscalers such as Amazon and Google, hardware, software, power, and even metals and mining stocks.
As an example of what’s driving this market, take an old stalwart—Corning. This company specializes in glass, ceramics, and related materials and technologies including advanced optics. As it turns out, hyperscalers need Corning’s optical fiber and connectivity products to wire together AI clusters at scale. The technology is advanced, but the numbers are simple: Corning’s revenue has increased by about $4 billion in the last two years while its operating margin—that is, profits after deducting operating expenses—has doubled. Future expectations are high for Corning, and the stock has responded by nearly tripling in just the last six months.
It should be noted that earnings growth resulting from the AI buildout makes a case for both bullish and bearish outlooks. Analysts expect earnings to continue to increase in the coming quarters, while profit margins have expanded to record levels. The average net profit margin on an S&P 500 company is nearly 15 percent, roughly double the long-term average profit margin. The market optimist views this as a positive catalyst for continued growth, while the pessimist worries whether this trend can continue.
In managing your investment portfolios, we try to balance these competing narratives by starting with your financial plan. The better we can understand your cash flow needs and financial objectives, the better we can position your portfolio to capture market upside when it materializes, while also providing stability during inevitable periods of market disruption.
Do I Own That?
You may have noticed some particularly high-flying stocks in the news. The AI buildout requires a lot of memory, and chipmakers have been able to raise prices and take advantage of imbalances between supply and demand. Stock of chipmaker Micron has quadrupled, while other chipmakers such as AMD (+171%), Intel (+278%), Samsung (+115%), and Sandisk (+857%) also have soared. Amid these kinds of market events, you may be wondering, do I own these stocks?
As a matter of fact, these names all show up in the funds we hold in model portfolios. One of the great benefits of exchange-traded funds (ETFs) is their low-cost broad diversification across thousands of individual stocks. Our single largest model position is SPYM, which provides market-cap weighted exposure to the 500 companies that make up the S&P 500 index at an expense ratio of just 0.02%.

Even a fractional allocation to extraordinary stocks can have a measurable impact on portfolio performance. In our model 60/40 portfolio, for example, Micron was the single biggest positive contributor to portfolio performance in the first half of this year, despite the fact that it comprised less than 1 percent of the overall model. The green table shows the portfolio’s largest contributors of performance in the first half of 2026. All of them are closely tied to the AI buildout: Micron, Lam Research, Intel, AMD, Samsung, Applied Materials, Sandisk, and ASML.
Academic research has shown that consistently picking individual stocks that outperform the broader market is nearly impossible. Our approach of using broadly diversified ETFs gets around this difficulty, allowing us to better capture returns wherever they materialize.
Summer Is Upon Us
As of this writing, an oppressive heat wave threatens much of the country. At Tableaux, we love the summer because we get to bring in new faces as our summer interns. This year we are pleased to announce summer interns Noah Collingwood and Stan Wojtkowski.
Noah is a Berkshire County native and a rising senior at the Isenberg school of Management at UMass, where he is pursuing a BBA in Finance and a BS in Hospitality and Tourism Management. He brings an unbridled passion for markets.
Stan is a rising sophomore at Taconic High School, where he is studying Multimedia. He is an avid sports lover, fisherman, and music enthusiast. We’re excited to have Noah and Stan on board this summer!
Tableaux Wealth July Market Picture
Finally, we invite you and your friends to join us for our next quarterly Tableaux Market Picture webinar on Friday, July 17 at 1:00PM ET. All online registrants will receive a link to a recorded version of the webinar after the event.