A U.S. Economy Powered by AI
The most frequently asked questions we’ve received from clients of late are: “Is AI in a bubble?” and “What’s your strategy for an AI pullback?”
We think this largely stems from a series of headlines over the past few months that have been skeptical regarding the run-up over the past few years of a variety of stocks that are considered part of the AI revolution. Many of these articles prey on investors’ fear of the potentially revolutionary technology and their concern that the promise may not live up to the hype.
Inevitably, comparisons to the dot-com bubble,[1] the subprime mortgage bubble,[2] and the Great Depression[3] frequently fail to provide proper context and meaningful facts for the average person.
For our part, we take a more measured view based on three key observations of what we know now. First, for the past three years, the stock market has done historically better than it has on average. Second, the publicly-traded tech companies at the forefront of AI have generally had strong earnings that are being plowed back into data center construction. (More recently, however, they are starting to turn to the bond market to borrow, as their profits are insufficient to fund the necessary investments for AI.) And third, the data and charts that we monitor indicate that the AI infrastructure build-out is responsible for an ever-increasing percentage of the economic growth in the U.S. economy.
In light of these observations, we think it’s a prudent time to consider rebalancing back to one’s long-term strategic asset allocation. And in some cases we think reducing your equity exposure may make sense given near-term (one- to three-year) cash needs, the tax consequences of selling, and your overall financial plan.
Equities both here and abroad have done historically well in recent years. As you can see in the chart below, three measures of stock market performance—the S&P 500 (large U.S. companies), the MSCI All-Country World Index (companies worldwide from both developed and emerging markets), and the Russell 2000 (small and midsize U.S. companies)—have each done significantly better over the last three years compared to their average returns.
Most extraordinarily, the S&P 500 has averaged more than double its annual return, at 20.5%, versus its annual return going back to 1988 of 9.17%. Could this outperformance continue? Yes! But we never know when a pullback, correction, or bear market will happen. For many investors, this recent stock growth means that the risk in their portfolio may border on or exceed the long-term risk level appropriate for their financial plan.
Moreover, unlike during the dot-com era, most of the companies driving returns in the stock market—the magnificent seven stocks of Alphabet (Google), Amazon, Apple, Meta Platforms, Nvidia, and Tesla—have achieved incredible and growing profits. As a result, their recent returns are much more in line with their profit growth, unlike during the 1990s tech bubble:


At the same time, these tech companies are now increasingly spending the vast majority of their profits on capital expenditures for AI infrastructure, at levels well above their long-term average, as shown in the chart below. Many are also borrowing heavily. For example, the chart below shows that Oracle is expected to spend 132% of its forecasted 2026 cash flow (earnings), which means that Oracle will borrow an estimated $25 billion a year for the next four years.[4]
Oracle and other data center infrastructure companies have been able to borrow vast sums due to future contracts from AI software providers such as OpenAI and Anthropic, but this borrowing may be reaching its limits. In fact, insurance on Oracle defaulting on its debts recently hit the highest cost since the global financial crisis.[5]
The bottom line is that borrowing, also known as leverage, intensifies the potential for gain—and for loss, if the revenues expected to cover the debt fail to materialize. The debt levels of these companies, and related special purpose vehicles and joint ventures, will be very important to watch in determining whether the current AI investment speculation is sustainable.

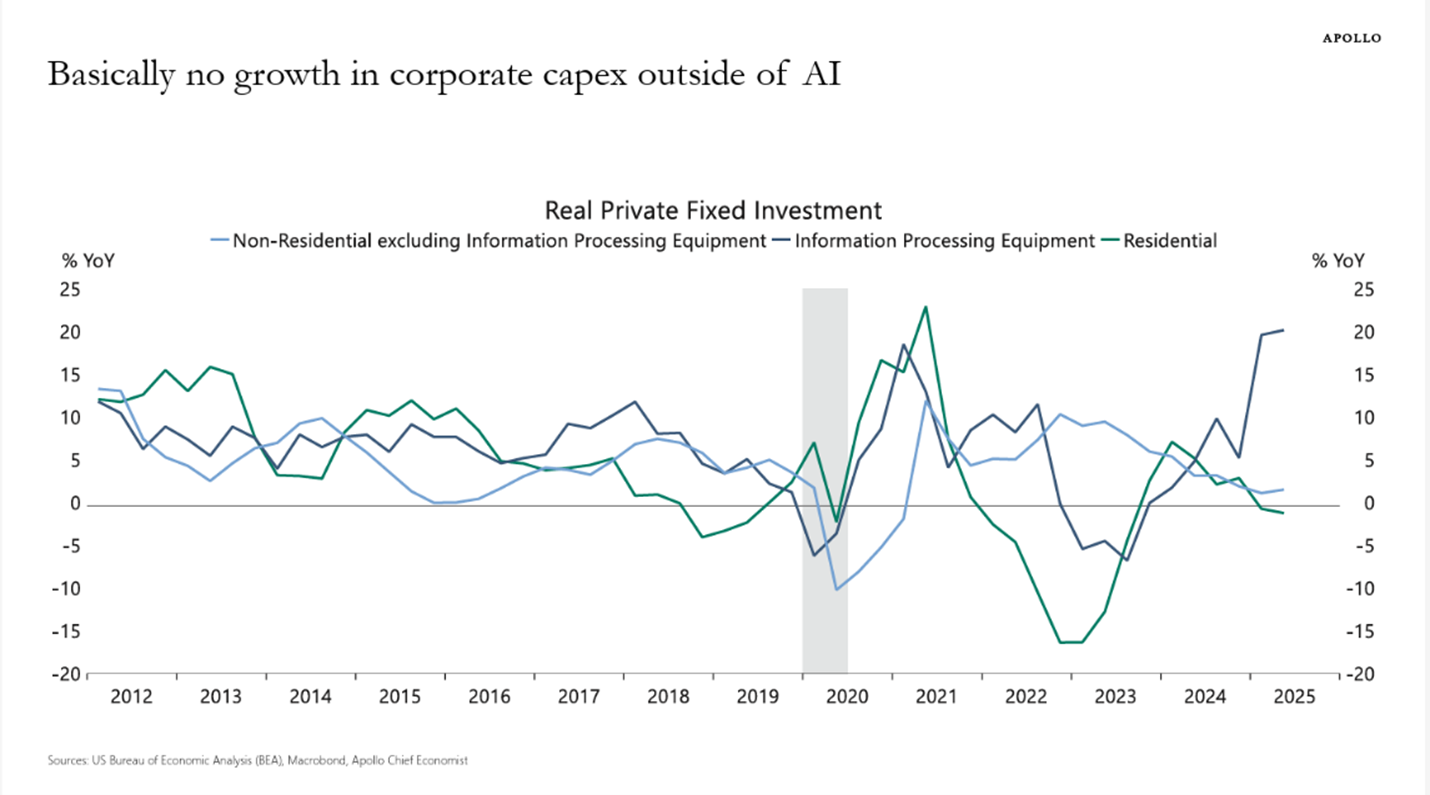
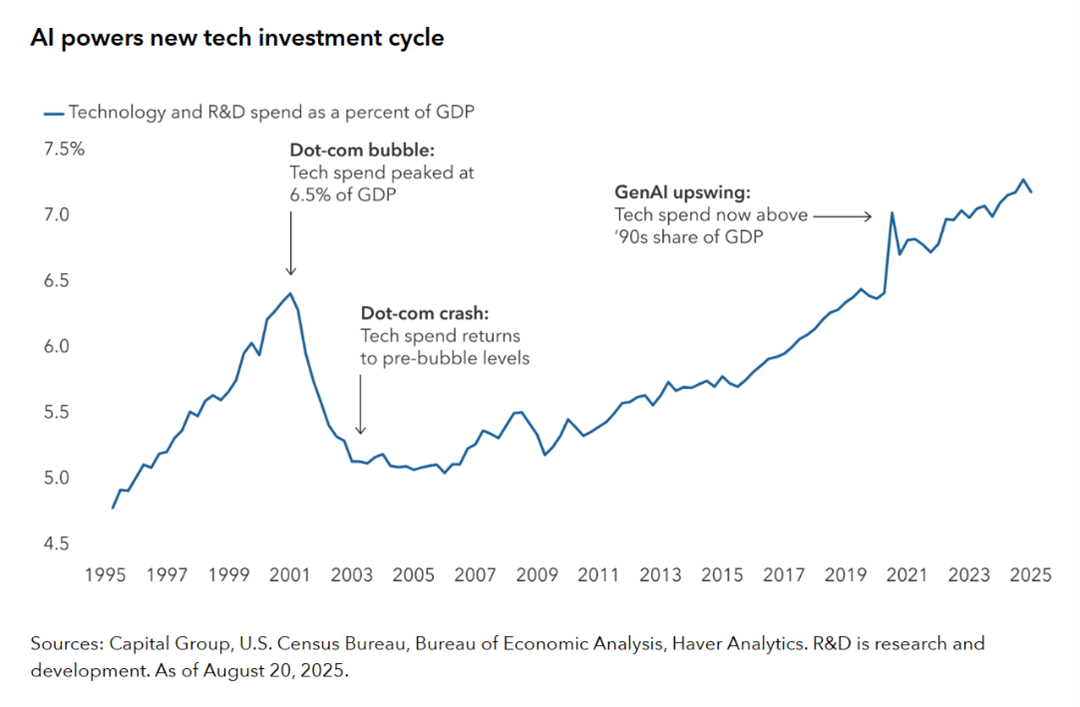
Finally, the U.S. economy has recently relied heavily on AI infrastructure buildout for economic growth, at the same time as other drivers of growth have slowed. As shown in the chart below, nonresidential investment (that is, spending by companies) has been essentially flat outside of information processing equipment that goes into newly constructed data centers. Spending on new homes and improvements to existing properties is similarly lackluster. By one estimate, the current AI infrastructure build-out as a percentage of US GDP exceeds the dot-com era and continues to rise (second chart below).
So while we don’t know when the datacenter construction boom will end, given the three considerations above we think it’s a good time to look closely at your current portfolio with your advisor and determine whether any rebalancing or adjustments make sense at the end of 2025 and the beginning of 2026.
[1] https://fortune.com/2025/09/28/ai-dot-com-bubble-parallels-history-explained-companies-revenue-infr…
[2] https://futurism.com/future-society/ai-hype-investment-subprime-bubble
[3] https://www.newyorker.com/news/the-financial-page/the-ai-boom-and-the-spectre-of-1929
[4] Oracle will have to borrow at least $25B a year to fund AI fantasy, says analyst
[5] Oracle Fear Gauge Closes at Highest Since 2009 on AI Worries - Bloomberg